Orkes Tracer#
The Orkes tracer is a powerful tool for debugging and understanding your workflows. It automatically captures detailed information about the execution of your graph, including the inputs and outputs of each node, and any LLM calls made within them.
This detailed, step-by-step record of your graph’s execution is invaluable for debugging complex logic, optimizing performance, and gaining a clear understanding of how your state changes over time.
How to Use the Tracer#
Tracing is enabled by default when you run an Orkes graph. The primary way to interact with the tracer is by visualizing its output.
orkes_tracable#
The orkes_tracable is a decorator that you can apply to your Python functions to make them compatible with the Orkes graph. While it’s not strictly for tracing, any function wrapped with it will have its execution (inputs, outputs, and any errors) automatically captured in the trace when it’s run as part of a graph.
Here is a simple example of how to use it:
from orkes.graph import orkes_tracable

@orkes_tracable
def my_function(input_1: str, input_2: int) -> dict:
    """
    A simple function that processes inputs and returns a dictionary.
    """
    # Your function logic here
    result = {
        "output_1": f"{input_1}_{input_2}",
        "output_2": input_2 * 2
    }
    return result
When this function is used as a node in an Orkes graph, the tracer will automatically record the values of input_1 and input_2, as well as the dictionary that the function returns (if you use it in the graph). This allows you to inspect the exact inputs and outputs of each function in your graph, which is essential for debugging.
LLM Traces#
A key feature of the Orkes tracer is its automatic capturing of LLM interactions. When you make a call to an LLM service from within a node in your graph, the tracer will automatically record:
The exact prompt sent to the LLM.
The raw response received from the LLM.
Any tool calls requested by the LLM.
The final message returned by the LLM.
This makes it easy to debug agentic behavior and understand why your LLM is making certain decisions.
Visualizing Traces#
After running your graph, you can generate an interactive HTML file that visualizes the entire execution trace. This is the most powerful way to use the tracer.
To generate the visualization, use the visualize_trace method on the GraphRunner object after running your graph:
from orkes.graph import OrkesGraph, GraphRunner

# ... (define your graph)

graph = OrkesGraph(state_class=MyState).add_node(...).compile()
runner = GraphRunner(graph)
final_state = runner.run(initial_state)

# Generate the trace file
runner.visualize_trace("my_workflow_trace.html")
This will create an HTML file that you can open in your browser.
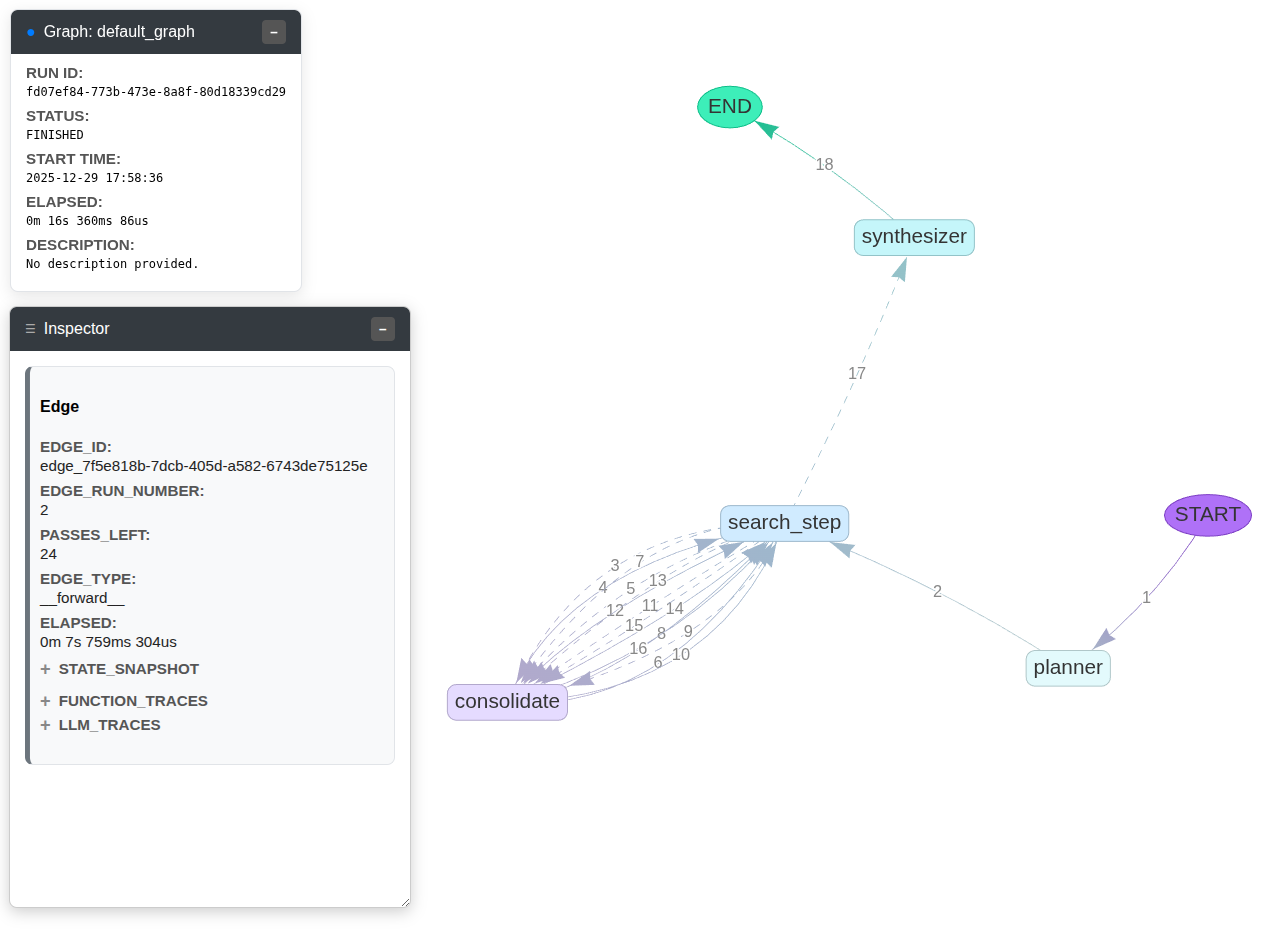
The visualization shows:
The complete graph structure.
The exact path of execution through the graph.
A detailed view of the state at the beginning and end of each step.
A dedicated section for every LLM call, showing the prompts and responses.
Using the visualizer is the most efficient way to debug and understand your Orkes workflows.